fig.add_subplot 을 이용하면 한 figure 내에 여러 개의 subplot을 그릴 수 있다.
Subplot 하나 배치하기
plt.figure를 실행하는 것으로는 아무런 그림도 그릴 수 없다.
fig = plt.figure(figsize=(1.5, 1.5))
Python
복사
# 결과
<Figure size 225x225 with 0 Axes>
Python
복사
plt.figure로 만들어진 Figure object fig 의 fig.add_subplot 메소드를 실행하여 axes 하나를 추가해보자. 비어있는 axes 하나가 만들어진 것을 알 수 있다.
fig = plt.figure(figsize=(1.5, 1.5))
ax = fig.add_subplot()
Python
복사
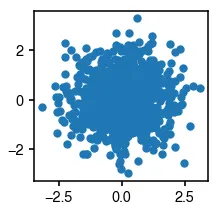
이제 ax 변수를 활용하여 원하는 그림을 해당 axes에 그리면 된다.
import numpy as np
fig = plt.figure(figsize=(1.5, 1.5))
ax = fig.add_subplot()
ax.scatter(np.random.normal(size=1000), np.random.normal(size=1000))
Python
복사
여러 subplot 배치하기
하나의 Figure에 여러 개의 subplot을 배치하고 싶으면 어떻게 할까? fig.add_subplot(행의 수, 열의 수, index) 를 이용하면 된다. 축약하여 fig.add_subplot(111), fig.add_subplot(437)과 같이 작성할 수도 있다.
예시) fig.add_subplot(1, 1, 1) : 1행 1열 격자의 1번째 cell에 axes를 배치하여 리턴한다
예시) fig.add_subplot(4, 3, 7) : 4행 3열 격자의 7번째 cell (=2행 3열)에 axes를 배치하여 리턴한다.
예시) fig.add_subplot(437) : 4행 3열 격자의 7번째 cell (=2행 3열)에 axes를 배치하여 리턴한다.
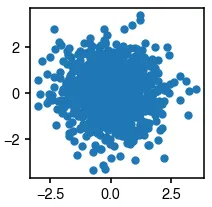
# 1행 1열 격자에 axes들을 배치한다.
fig = plt.figure(figsize=(1.5, 1.5))
ax = fig.add_subplot(1, 1, 1) # ax = fig.add_subplot(111)과 같다.
ax.scatter(np.random.normal(size=1000), np.random.normal(size=1000))
Python
복사
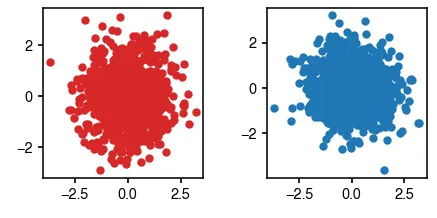
# 1행 2열 격자에 axes들을 배치한다.
fig = plt.figure(figsize=(3.3, 1.5))
for i, c in enumerate(['C3', 'C0']):
ax = fig.add_subplot(1, 2, i+1)
ax.scatter(np.random.normal(size=1000), np.random.normal(size=1000), c=c)
Python
복사
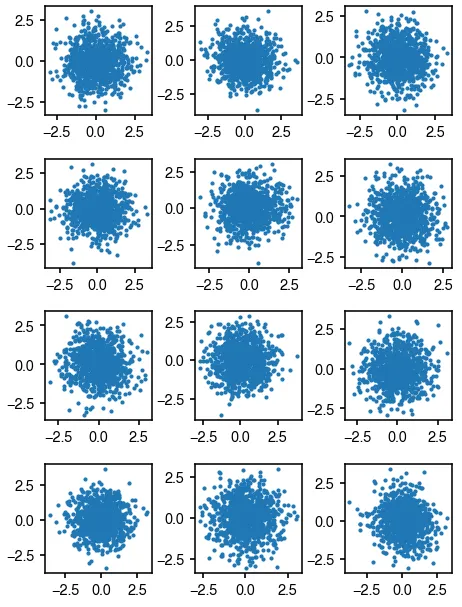
# 4행 3열 격자에 axes들을 배치한다.
fig = plt.figure(figsize=(3.5, 5))
for i in range(12):
ax = fig.add_subplot(4, 3, i+1)
ax.scatter(np.random.normal(size=1000), np.random.normal(size=1000), s=1)
Python
복사
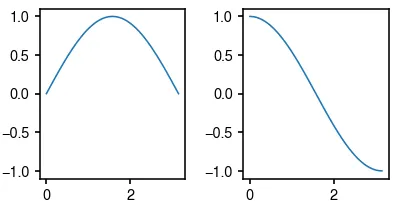
그래프 사이에 축을 공유하기
종종 두 axes가 같은 scale의 축을 가지도록 그래프를 그려야 할 상황이 생긴다. ax.set_xlim 혹은 ax.set_ylim으로 축 범위를 수동으로 지정해주는 방법도 있지만, 그보다 간편하게, add_subplot의 sharex 혹은 sharey 파라미터를 사용하는 방법을 공유한다.
# ax1과 ax2는 y축을 공유한다
fig = plt.figure(figsize=(3, 1.5))
ax1 = fig.add_subplot(121)
ax2 = fig.add_subplot(122, sharey=ax1) # ax2가 ax1과 y축을 공유하도록 한다.
x = np.linspace(0, np.pi, 100)
ax1.plot(x, np.sin(x))
ax2.plot(x, np.cos(x))
Python
복사
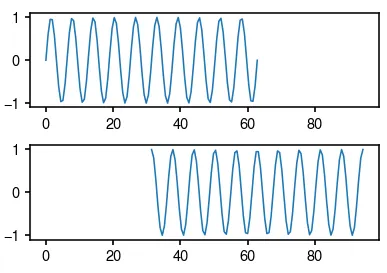
# ax1과 ax2는 x축을 공유한다
fig = plt.figure(figsize=(3, 2))
ax1 = fig.add_subplot(211)
ax2 = fig.add_subplot(212, sharex=ax1) # ax2가 ax1과 x축을 공유하도록 한다.
x1 = np.linspace(0, 20 * np.pi, 100)
x2 = np.linspace(10 * np.pi, 30 * np.pi, 100)
ax1.plot(x1, np.sin(x1))
ax2.plot(x2, np.cos(x2))
Python
복사